Real-time Log Visualization using Grafana, Loki, and Promtail on EC2 Instances


Table of contents
📍 Introduction:
In this blog, we will explore the concept of observability and how it can be achieved using Grafana, Loki, and Promtail. We will also walk through a hands-on monitoring and visualization project to demonstrate the power of these tools.
🔹 What is Observability?
Observability is the ability to understand the internal state of a system based on its external outputs. In other words, it is the ability to monitor and analyze the behavior of a system in real-time to identify issues and improve performance. Observability is crucial for maintaining the reliability and availability of software systems.
🔹 Grafana:
It is an open-source platform for monitoring and observability. It provides a powerful and flexible interface for visualizing data from various sources. Loki is a horizontally-scalable, highly-available, multi-tenant log aggregation system inspired by Prometheus. Promtail is an agent that ships the logs from the application to Loki.
Hands-on Monitoring and Visualization Project In this project, we will be monitoring a sample application and visualizing its logs using Grafana, Loki, and Promtail. The application is a simple web server that generates logs for each request it receives.
🔹 Loki Setup and Connection:
The first step is to set up Loki. We will be using Docker to run Loki. Once Loki is up and running, we need to configure Promtail to ship the logs to Loki. We will create a configuration file for Promtail that specifies the location of the logs and the address of the Loki server. Once the configuration is set up, we can start Promtail and verify that the logs are being shipped to Loki.
🔹 Promtail Setup and Connection:
The next step is to set up Promtail. We will be using Docker to run Promtail. Once Promtail is up and running, we need to configure it to ship the logs to Loki. We will create a configuration file for Promtail that specifies the location of the logs and the address of the Loki server. Once the configuration is set up, we can start Promtail and verify that the logs are being shipped to Loki.
🔹 Grafana Project:
The final step is to set up Grafana and create a dashboard to visualize the logs. We will be using Docker to run Grafana. Once Grafana is up and running, we need to configure it to connect to Loki. We will create a data source in Grafana that points to Loki. Once the data source is set up, we can create a dashboard and add a panel to visualize the logs.
📝 Pre-requisites:
Before we begin, we need to set up an EC2 instance and connect to it. Once connected install nginx server on it then, we can perform the following steps:
🚀 Step 1: Install & Start Grafana
Install Grafana on Debian or Ubuntu
sudo apt-get install -y apt-transport-https
sudo apt-get install -y software-properties-common wget
sudo wget -q -O /usr/share/keyrings/grafana.key https://apt.grafana.com/gpg.key
Stable release
echo "deb [signed-by=/usr/share/keyrings/grafana.key] https://apt.grafana.com stable main" | sudo tee -a /etc/apt/sources.list.d/grafana.list
# Install the latest OSS release:
sudo apt-get install grafana
sudo systemctl start grafana-server
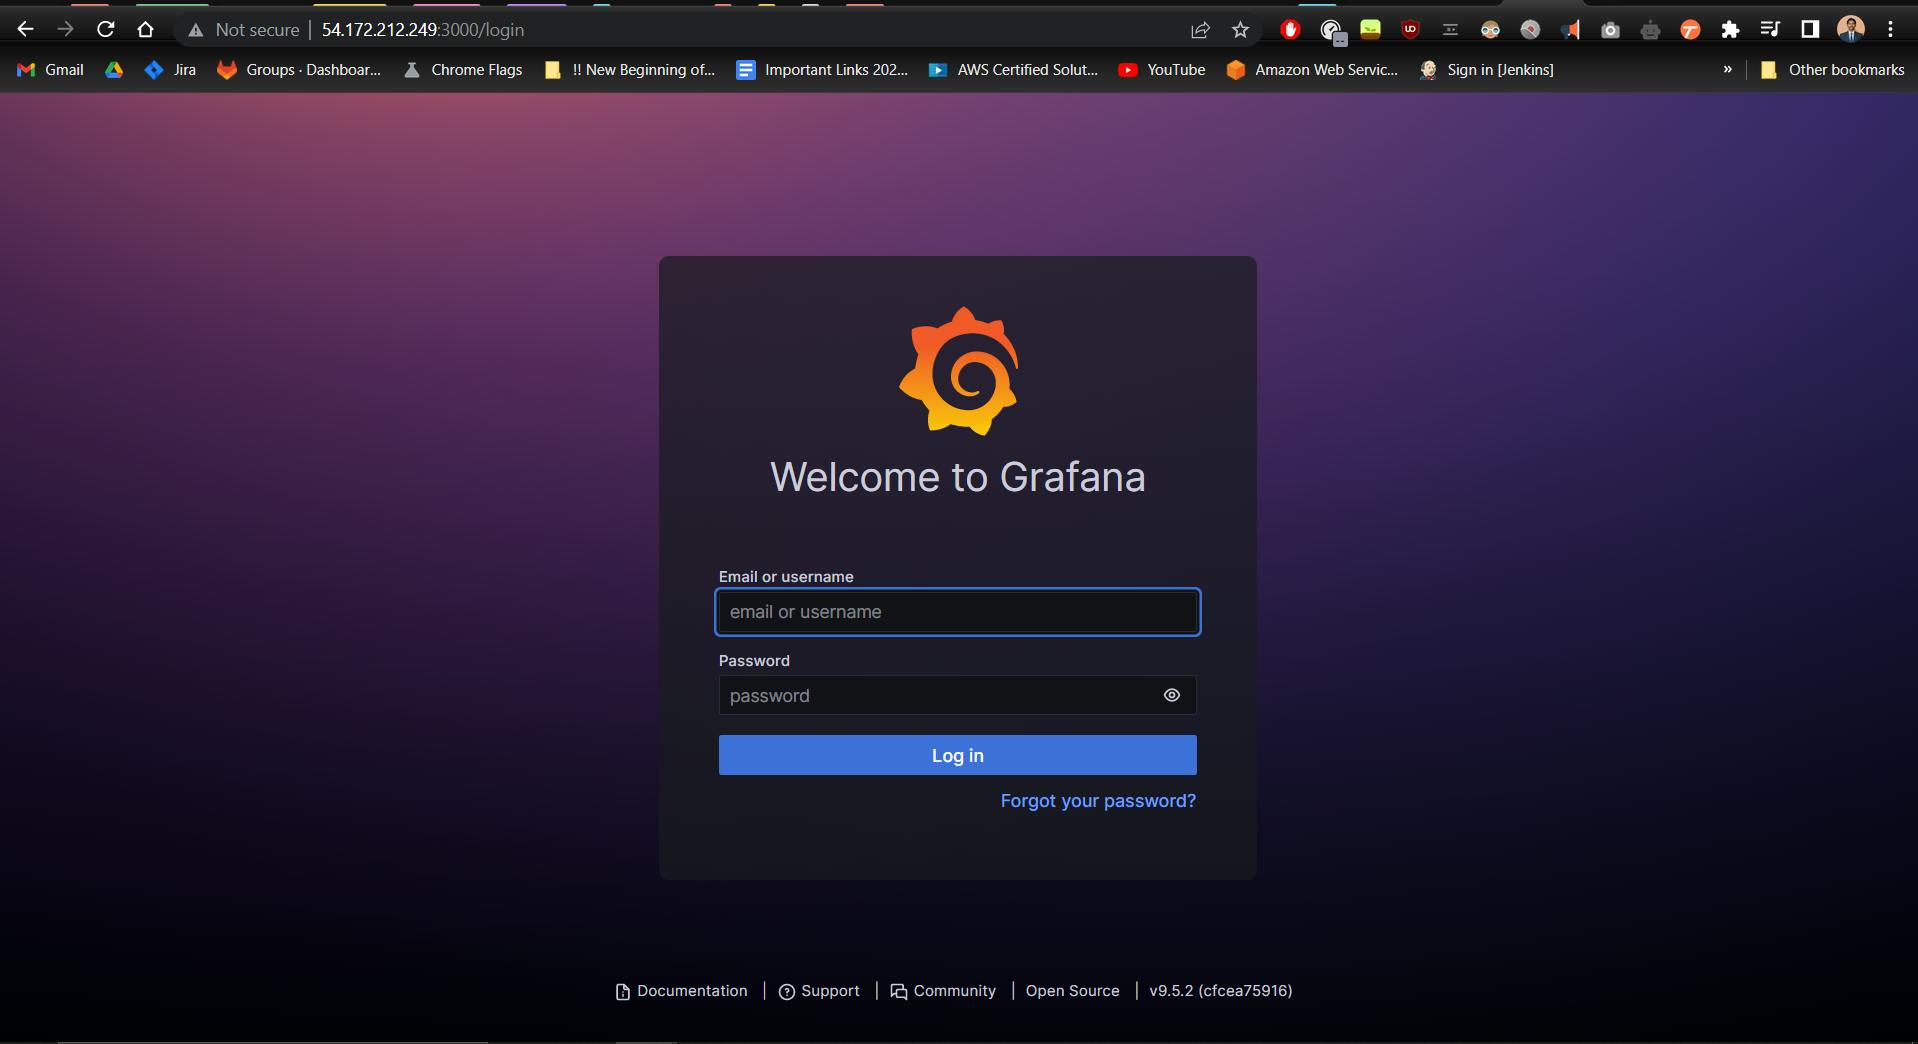
By default, Grafana runs on port 3000.
The default username and password are admin/admin.
Access Grafana by navigating to http://your-ec2-instance-ip:3000
🚀 Step 2: Install Docker
We need Docker to run Grafana, Loki, and Promtail.
Update package index: sudo apt-get update
Add user to Docker group: sudo usermod -aG docker $USER
🚀 Step 3: Create a directory for Grafana configs
- Create and navigate to the directory: sudo mkdir grafana_configs && cd grafana_configs
🚀 Step 4: Download Loki and Promtail configs
Download Loki config: wget raw.githubusercontent.com/grafana/loki/v2.8.. -O loki-config.yaml
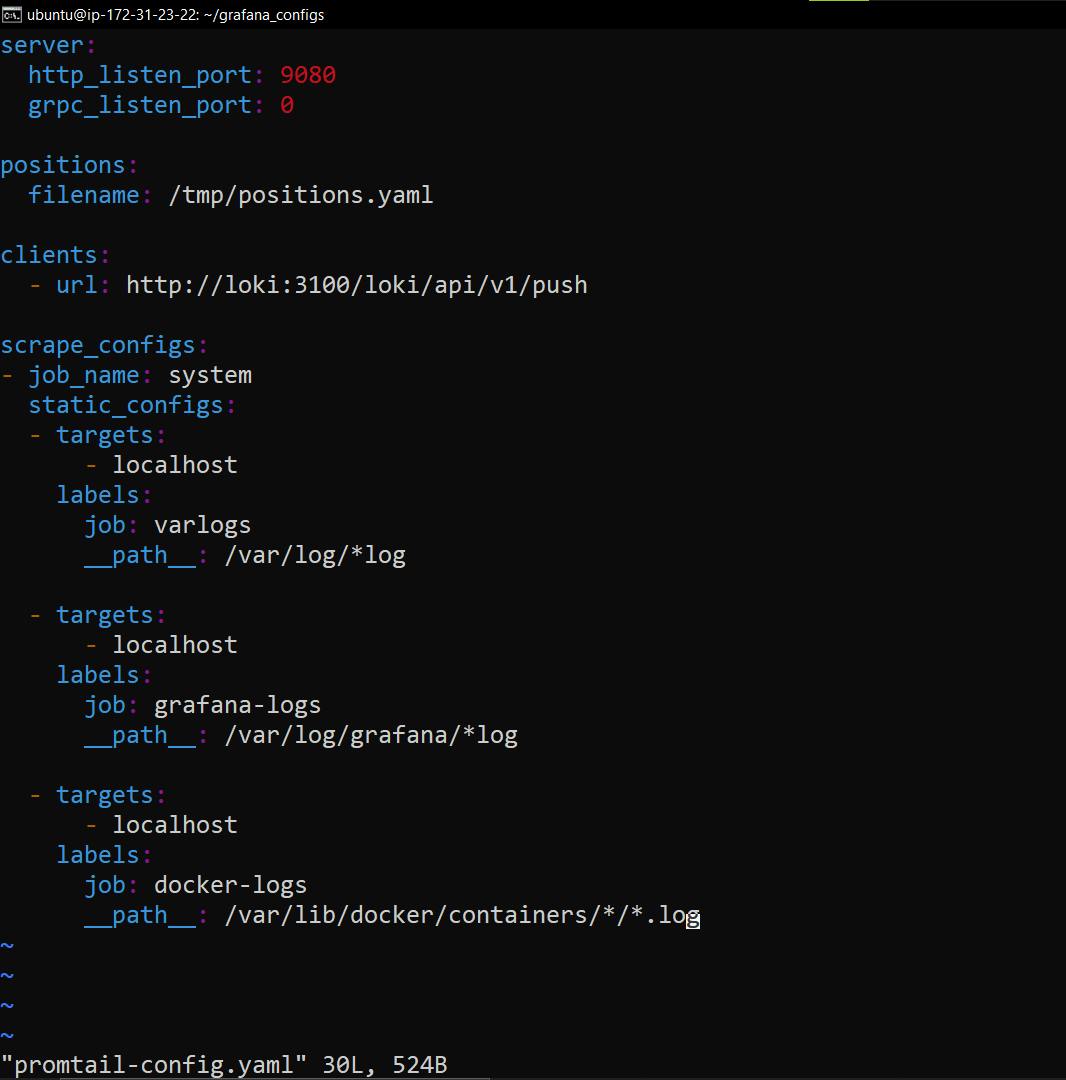
Download Promtail config: wget raw.githubusercontent.com/grafana/loki/v2.8.. -O promtail-config.yaml
🚀 Step 5: Run Loki
Run Loki with Docker: docker run -d --name loki -v $(pwd):/mnt/config -p 3100:3100 grafana/loki:2.8.0 --config.file=/mnt/config/loki-config.yaml
🚀 Step 6: Enable port 3100
- Configure your EC2 instance's inbound rule to enable port 3100.
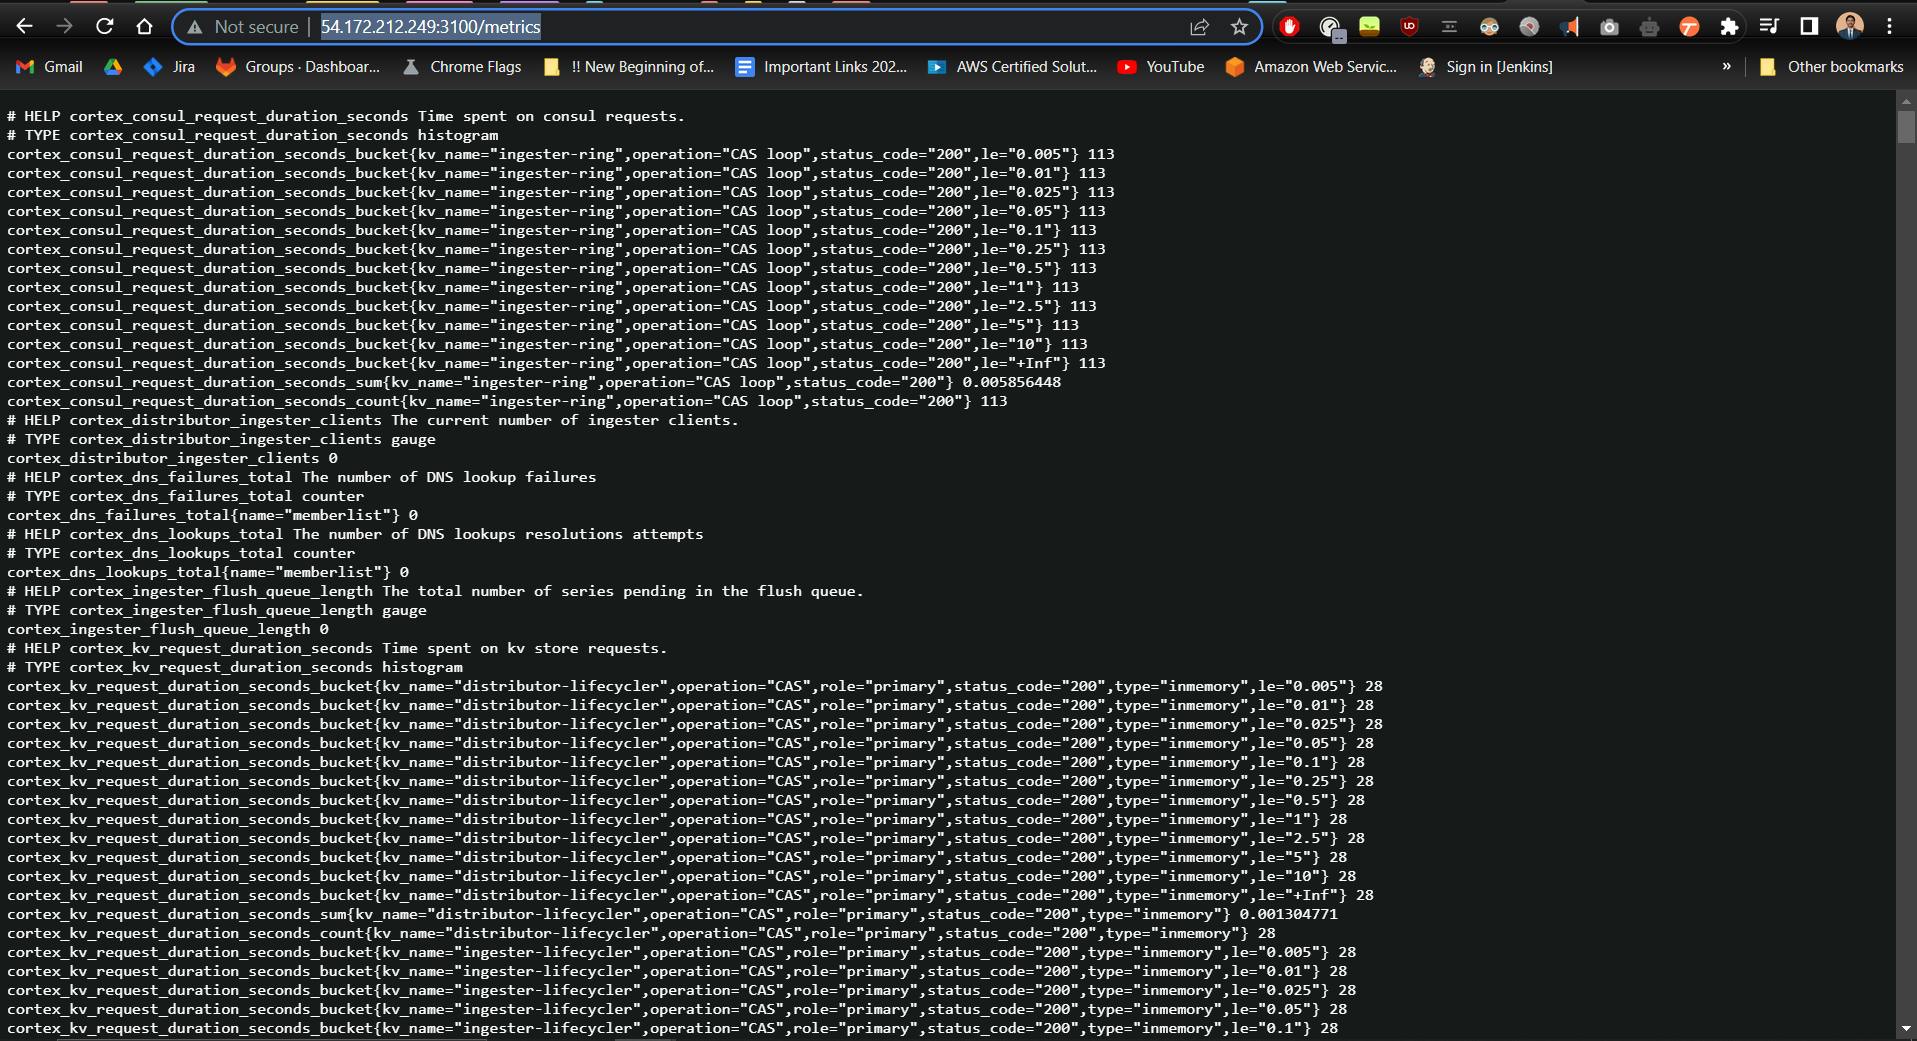
🚀 Step 7: Test Loki
- Test Loki by accessing: http://your-ec2-instance-ip:3100/metrics
🚀 Step 8: Run Promtail
- Run Promtail with Docker: docker run -d --name promtail -v $(pwd):/mnt/config -v /var/log:/var/log --link loki grafana/promtail:2.8.0 --config.file=/mnt/config/promtail-config.yaml
🚀 Step 9: Link Loki to Grafana
In Grafana, navigate to Configuration > Data Sources.
Add a new data source and select Loki.
Enter the Loki URL (http://your-ec2-instance-ip:3100) and save the configuration.
🔍 Step 10: Explore logs
Use the Explore tab in Grafana to view logs.
Select the Loki data source and enter a query like {job="varlogs"} to view logs.
🔍 Step 11: Filter logs
Use the query editor to filter logs by labels or text.
Example: {job="varlogs", app="nginx"} |~ "error"
🚀 Step 12: Show Grafana logs
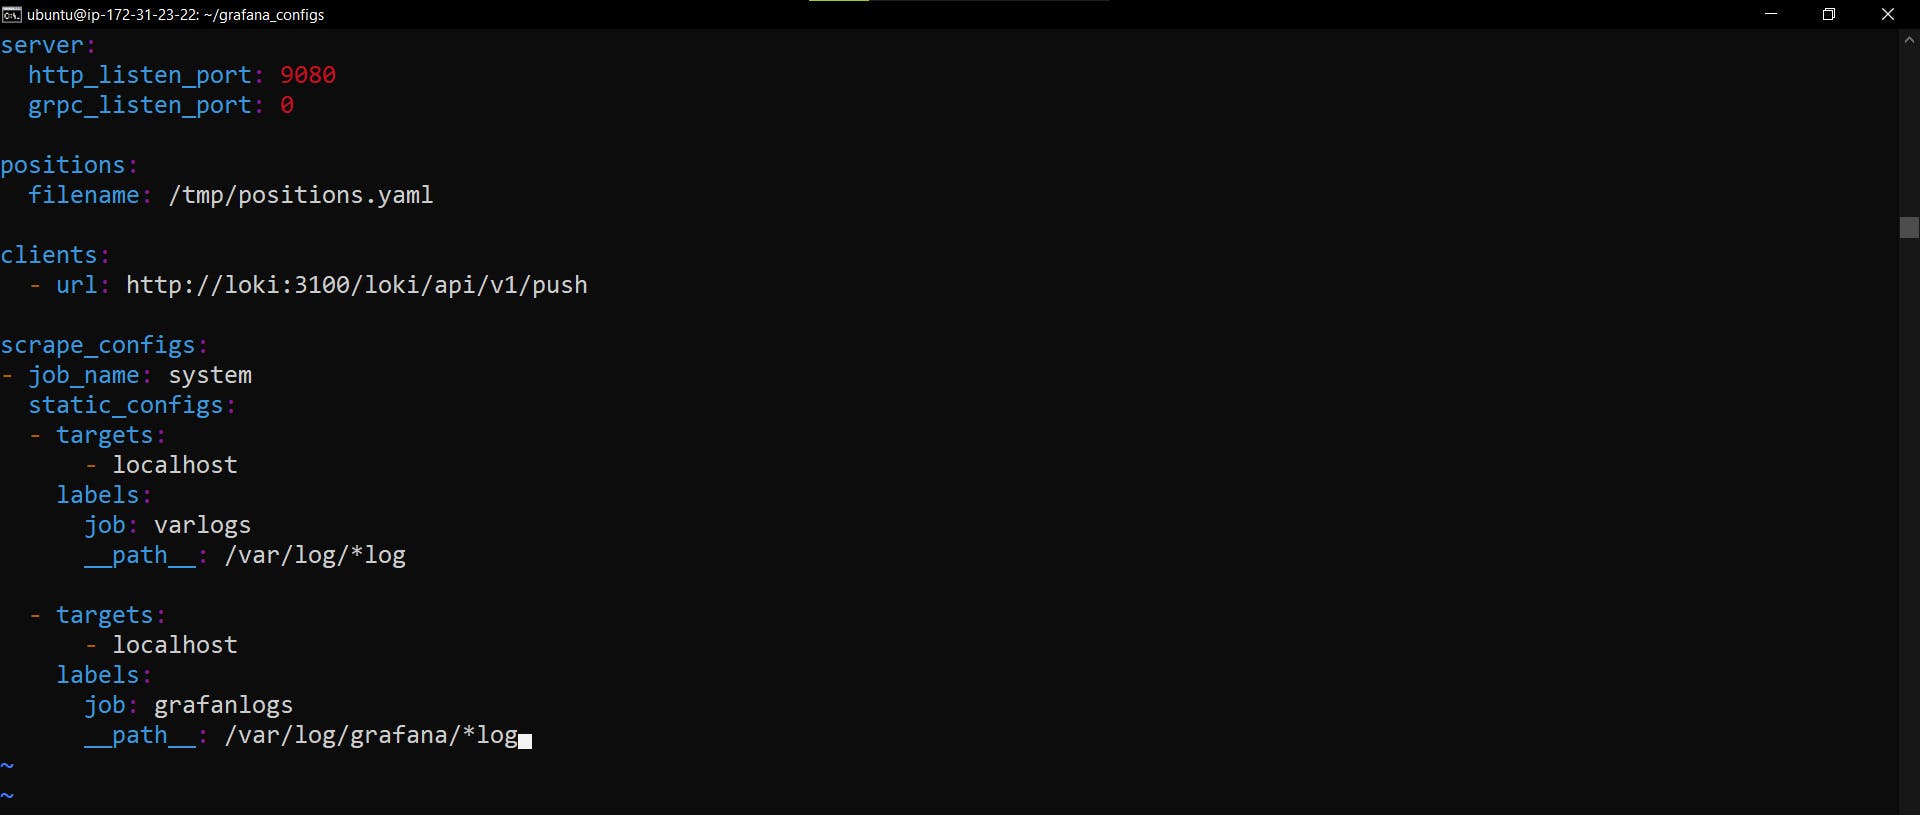
Add the Grafana logs path (/var/logs/grafana) to the Promtail config file.
Pass the logs to Loki and visualize them in Grafana.
🔄 Step 13: Restart Promtail
- Restart the Promtail Docker container: docker restart promtail-container-id
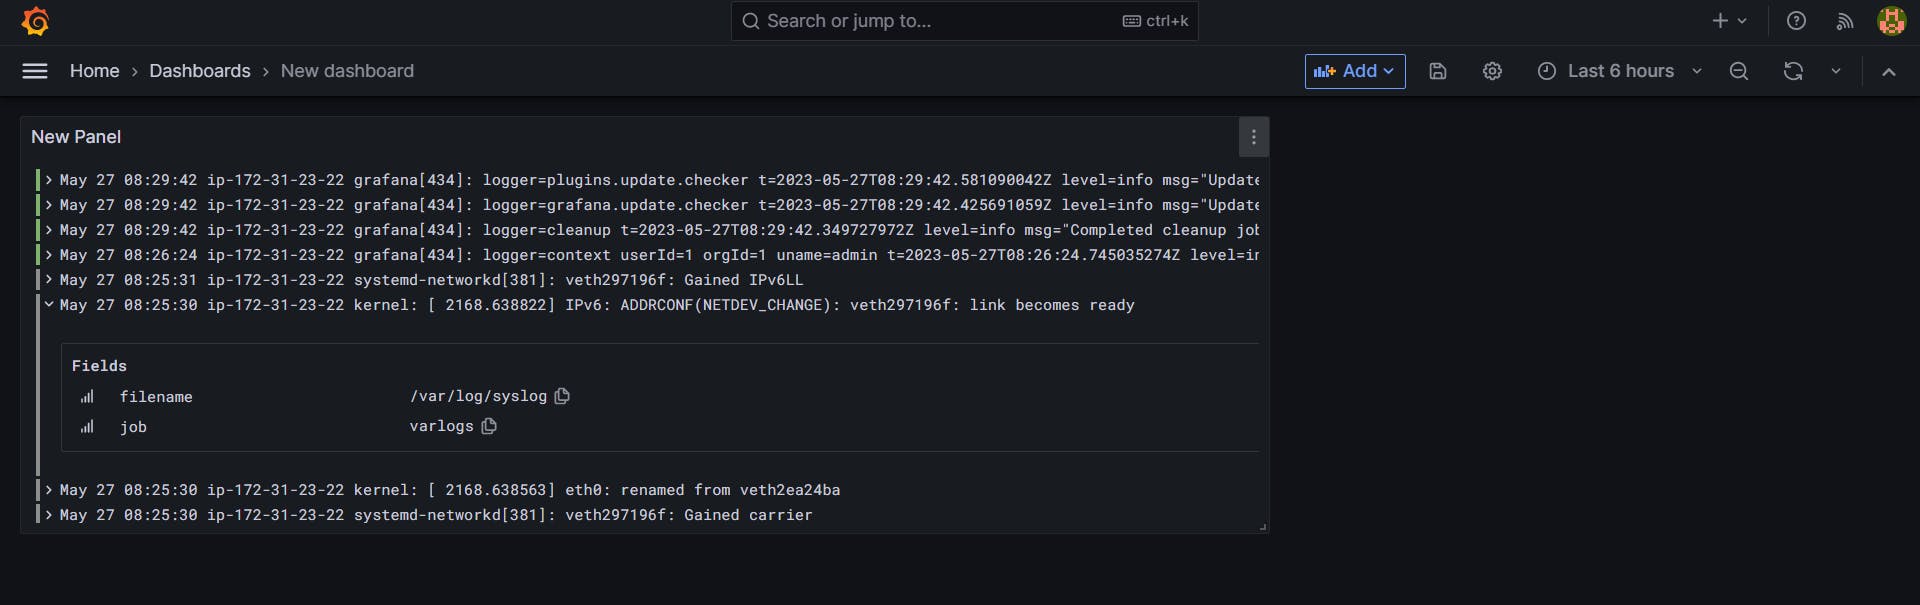
🔍 Step 14: Show system logs
- Use the Explore tab in Grafana to view system logs.
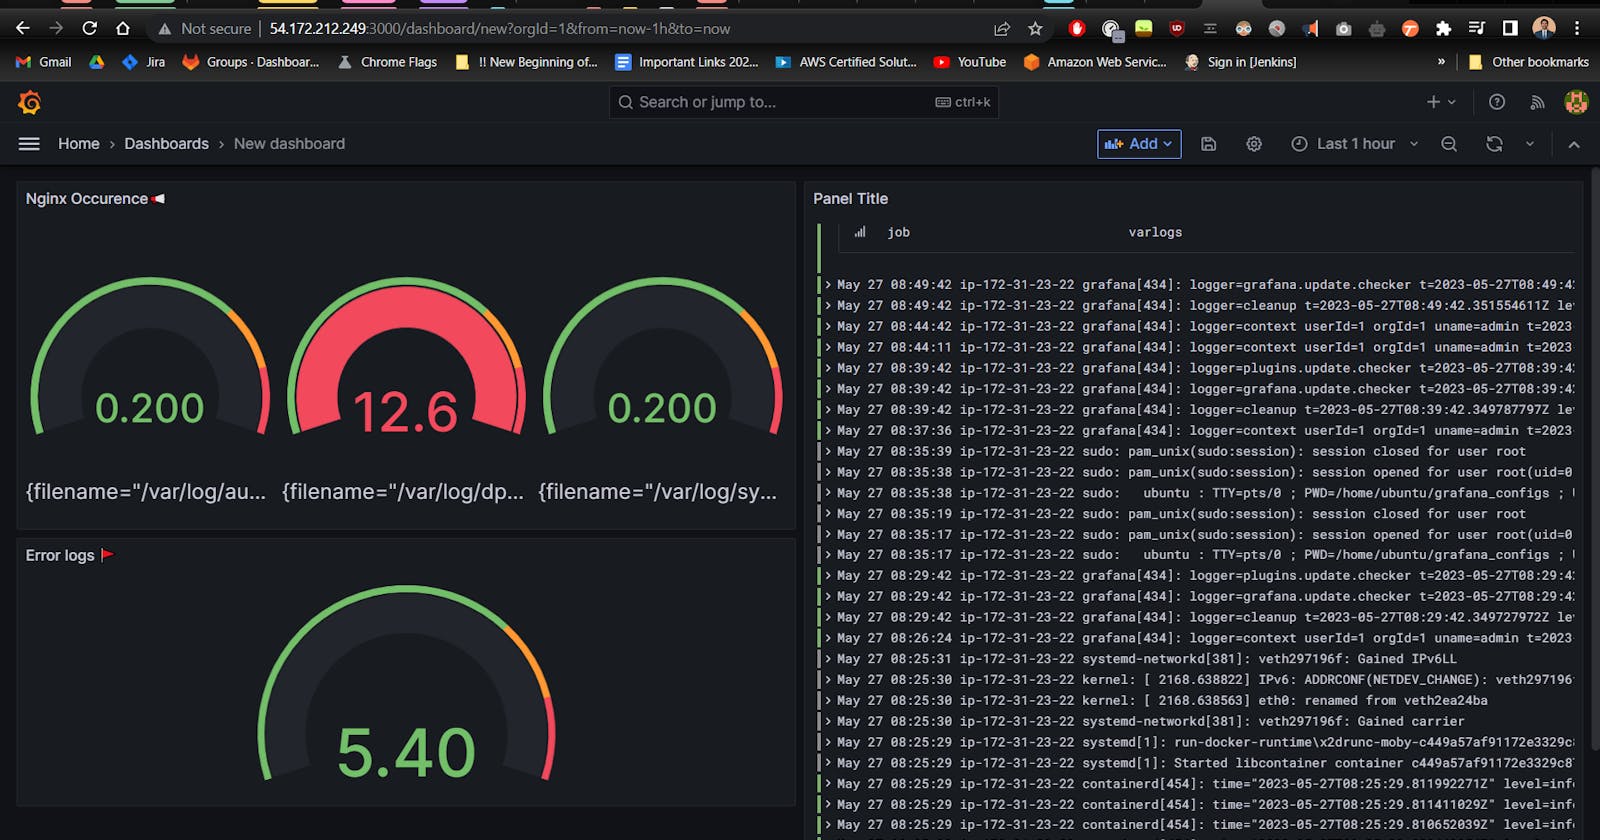
📊 Step 15: Configure visualization
Install and configure Nginx to plot graphs using its data.
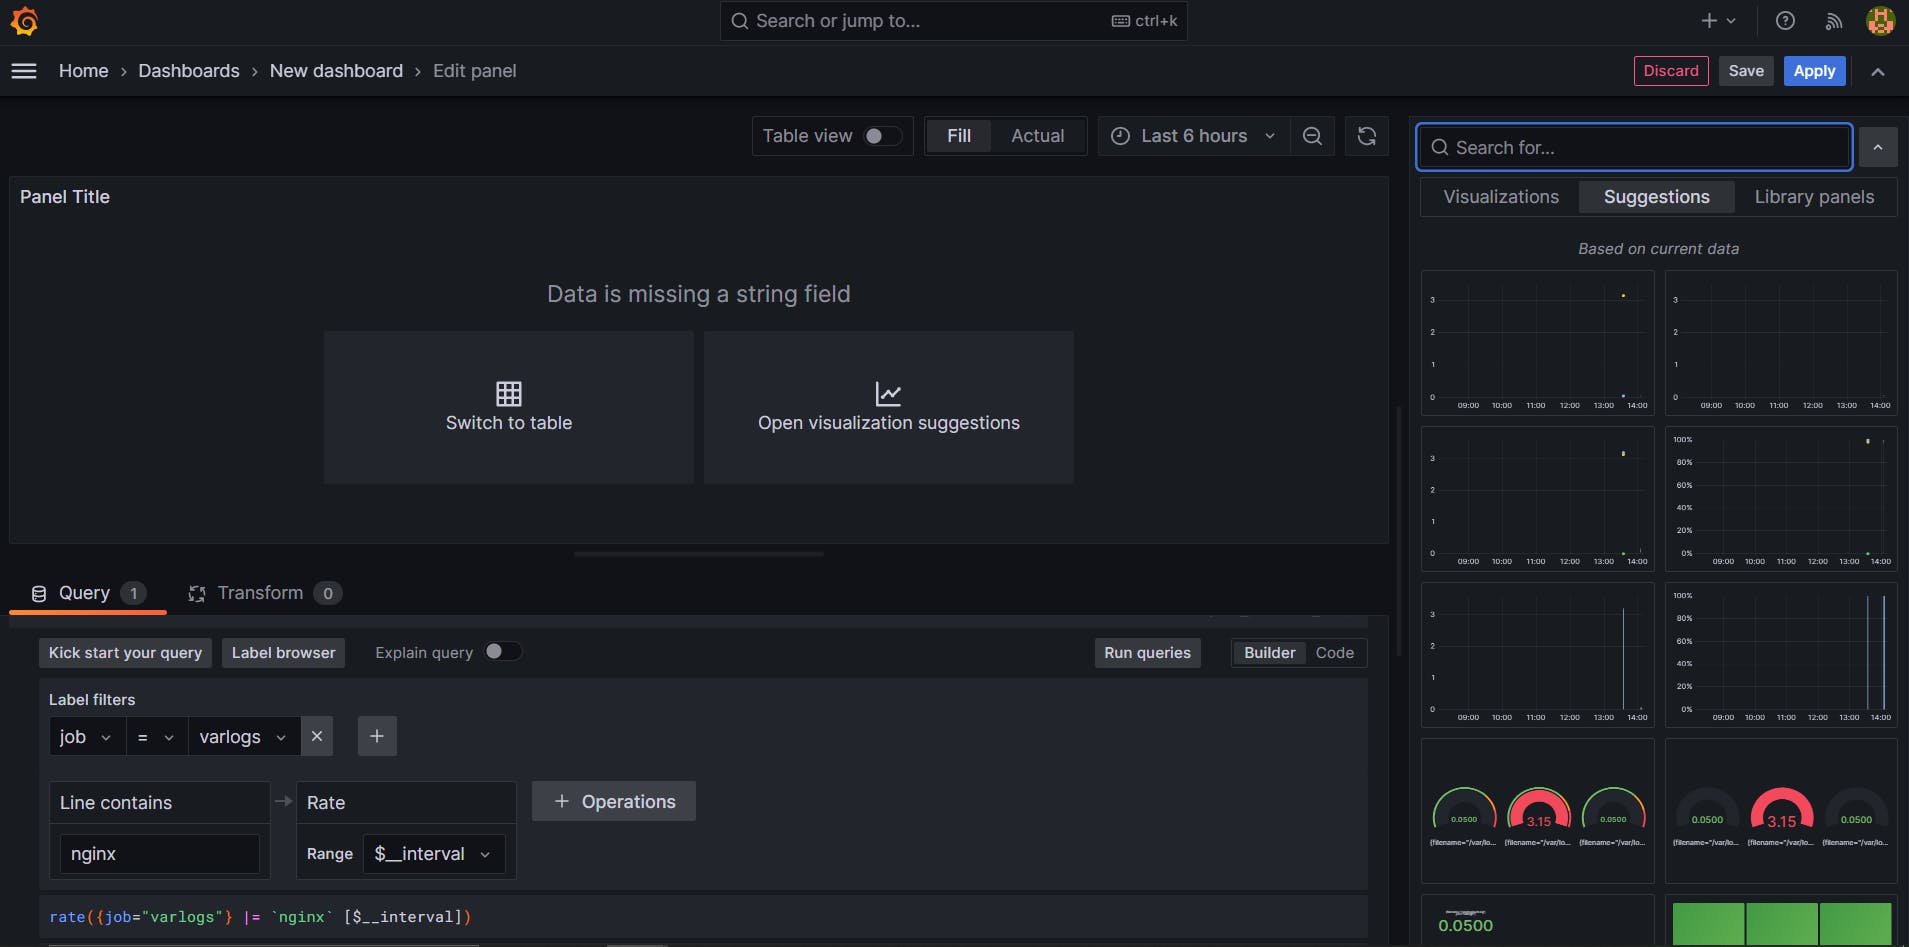
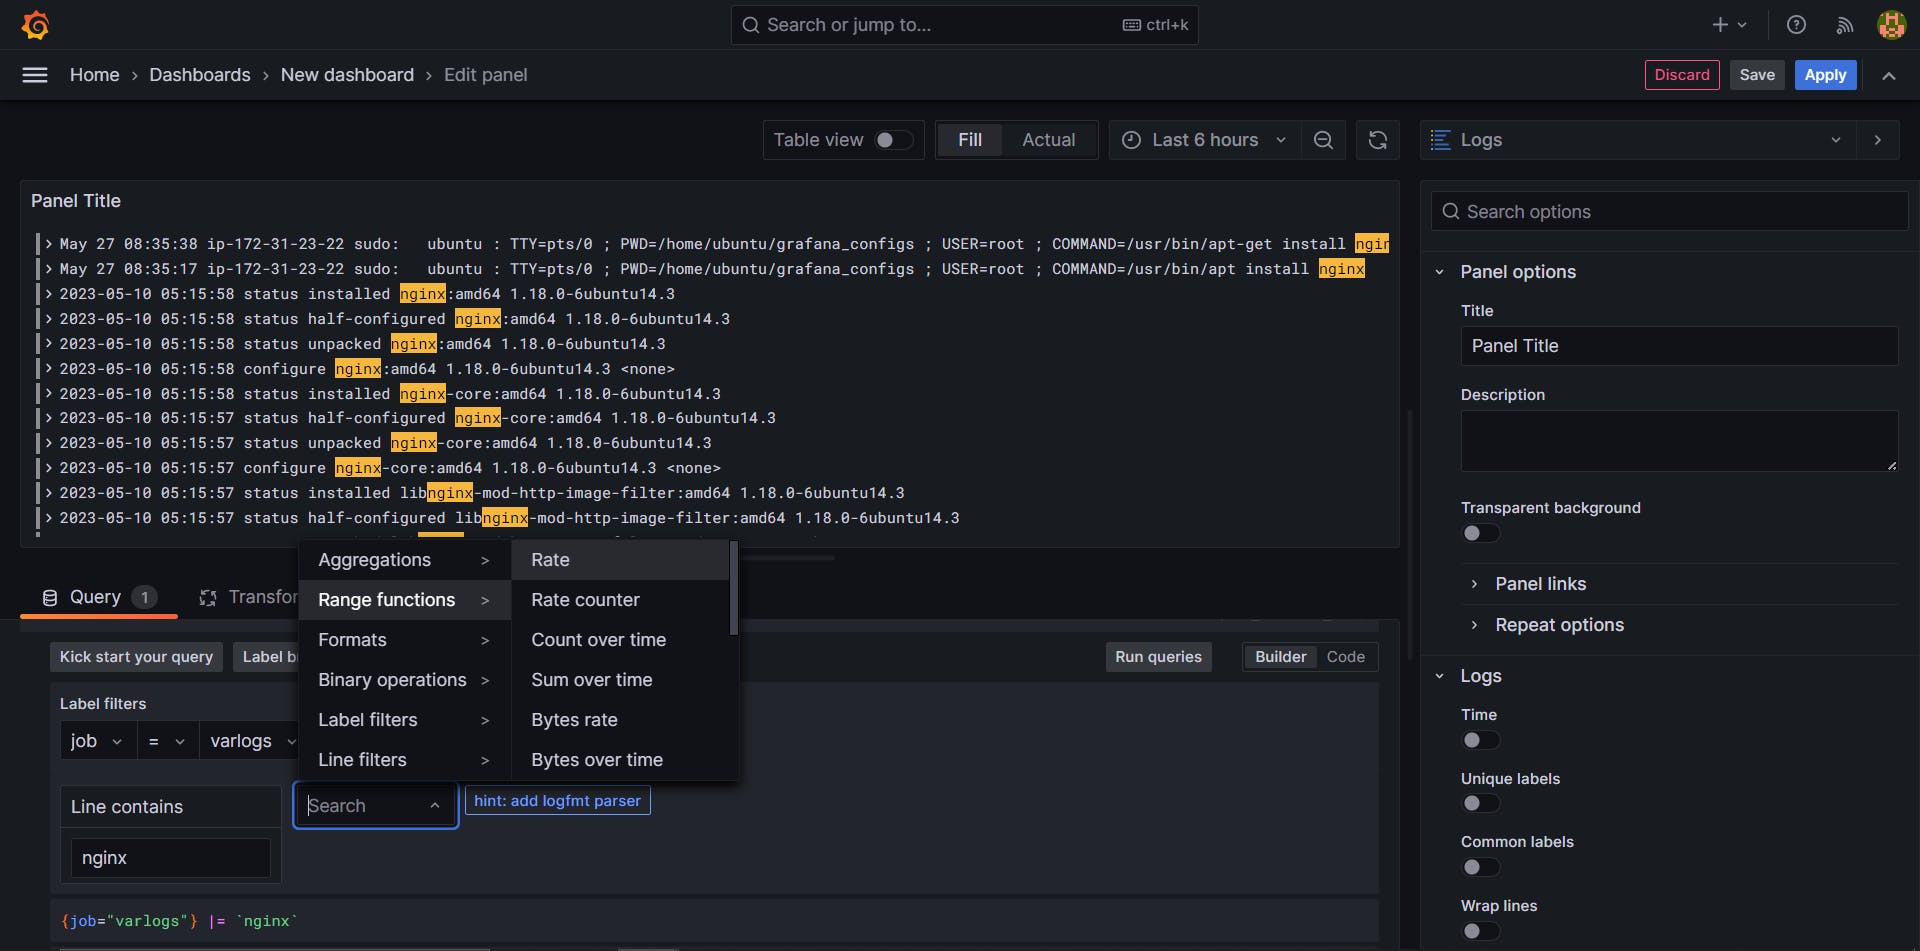
📊 Step 16: Show Nginx data visuals
Choose the data source (Loki default or another), job (varlogs), contains (nginx), and run queries to show visualizations.

🔍 Step 17: Check for errors
Use the Explore tab in Grafana to check for errors in logs.
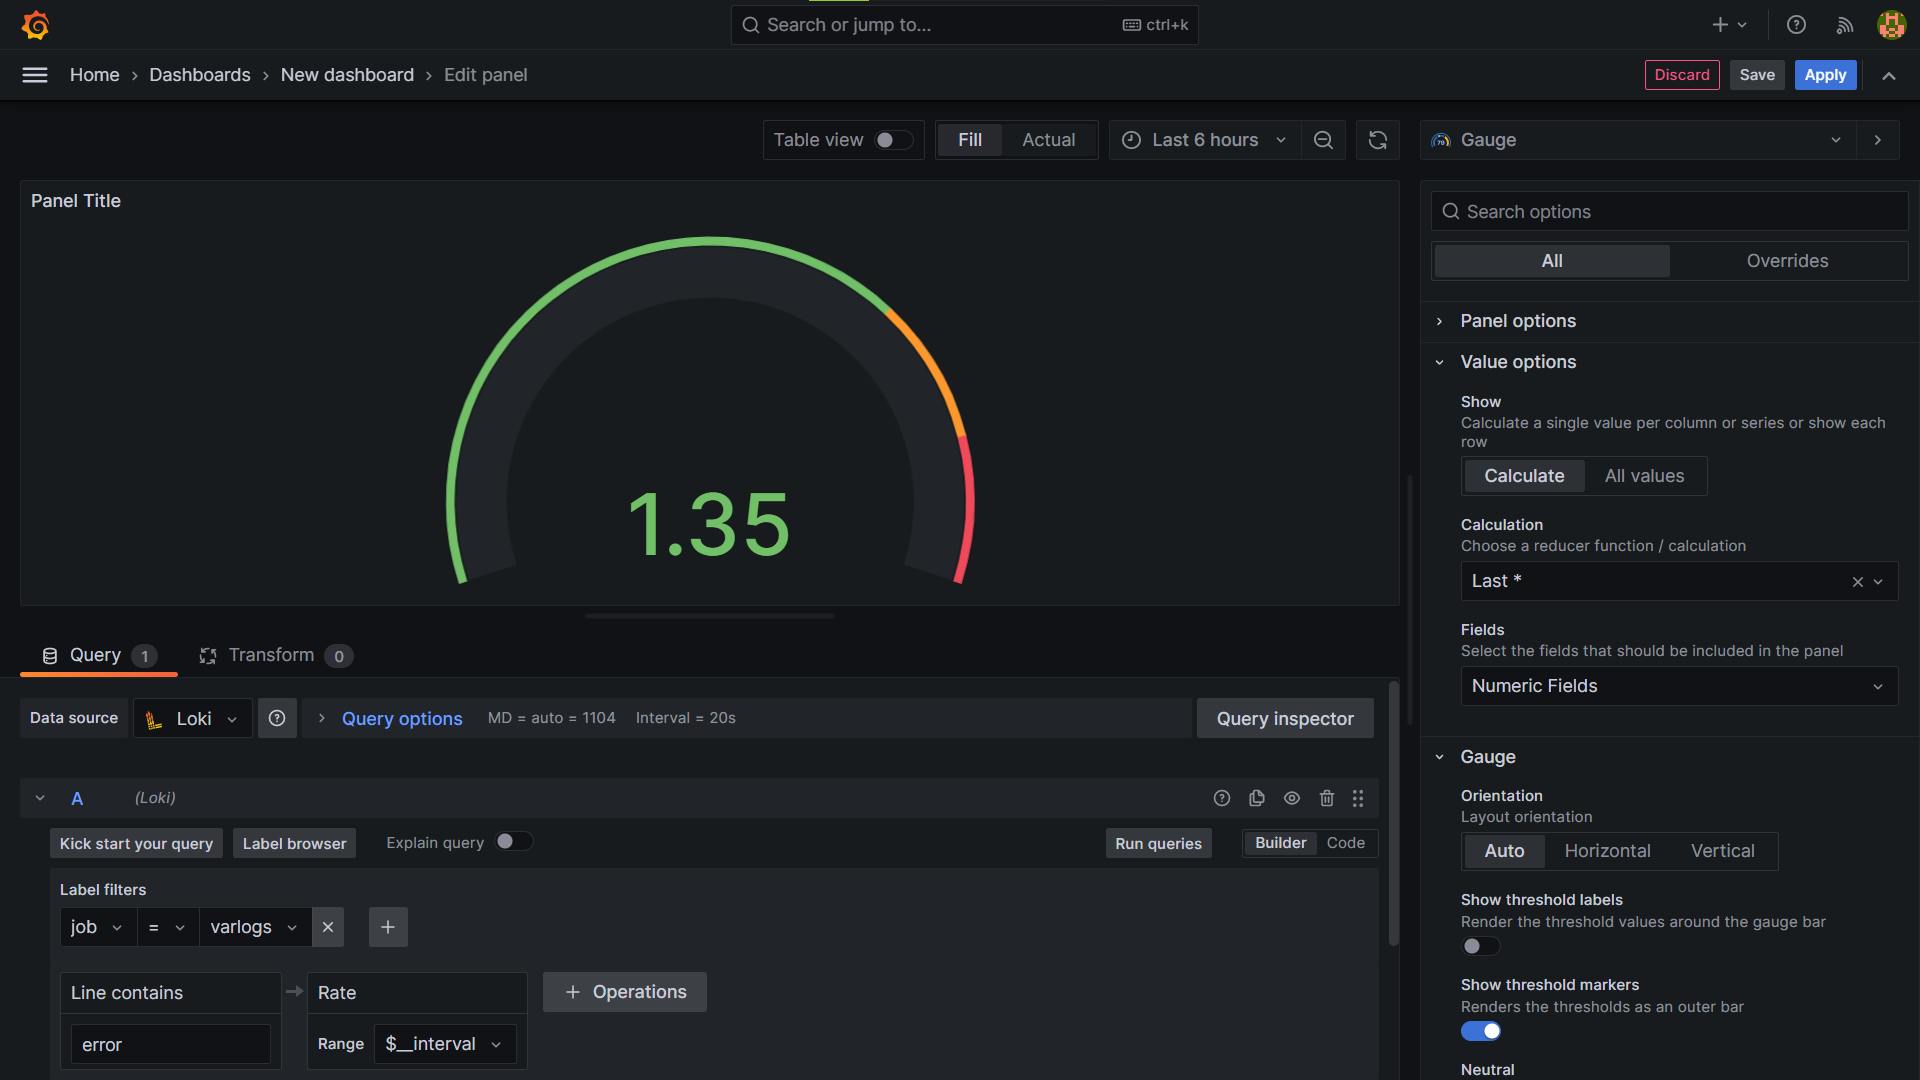
🎨 Step 18: Create Final dashboard
- Create a final dashboard for Nginx errors and system logs using Grafana, Loki, and Promtail.

🎉 Assignment task: To show the Docker logs in Grafana, use the following command to restart the Docker container:
- docker restart docker-container-id
📍 Conclusion:
In conclusion, Grafana, Loki, and Promtail are powerful tools for monitoring and visualizing logs in real time. By following these steps, you can set up a monitoring and visualization system for your applications. Remember to prioritize quality assurance and testing to ensure that your software is reliable and free of bugs and errors.
🔹 Checkout GitHub Repository for projects: